Value Components (TVC)
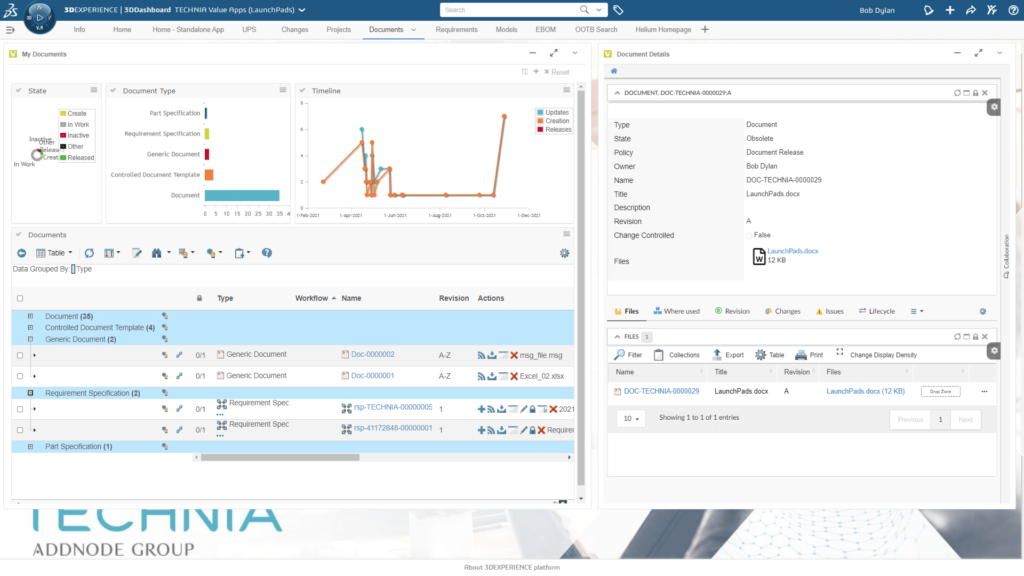
A rich set of configurable UI components for 3DSPACE, 3DDASHBOARD and standalone applications, that require no custom code.

Why Choose Value Components?
Improve Productivity
User Interface’s optimized to support your unique and most commonly used processes enable users to spend more time adding value. No time is wasted clicking around trying to locate the right information within the platform.
Accelerate User Adoption
Equipping users with an intuitive, speedy, and click-efficient experience that is adapted to your processes, is a good way to increase business adoption rates and ensure the platform is used to its full potential.
Minimise Cost of Ownership
Rapid deployment using version-independent configurations rather than version-specific custom code allows you to meet business demand OOTB, enabling painless upgrades and minimising lifetime cost.
Did you know that in a system with 10,000 users, a 5 minute time saving per user adds up to the total equivalent daily cost of over 100 employees?
Key Capabilities
- Enable users to define their own views and widgets directly in the application without the need for developers.
- No costly and time consuming customizations.
- Leverage visualisation in configurable dashboards for smart decision making
- Enhance Search - Configure search entry forms and result tables or your own starting page and reduce the need for search.
- Optimised Use Cases - Create streamlined applications or tailormade 3DEXPERIENCE viewports for specific use cases. UI’s optimized to perfectly match your most commonly used processes.
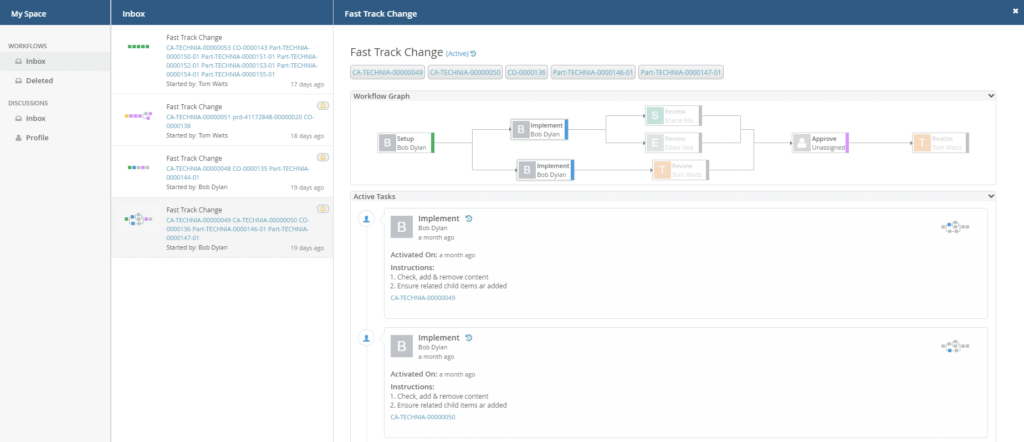
- UserGuidance - Make complex processes easy using configurable workflows with graphical overviews and instruction checklists.
- Increase Availability - Responsive UI’s enable flexible working across different devices and access to offline data where networks are unreliable.
- Inline Collaboration - Increase traceability of product related discussions that that usually end up in external email threads or chat dialogs.
- Manage Files - One click edit and check in. Take control over all checked out files with tracked location and quick actions. Drag & drop. File property transfer.
- Consolidated data retrieval and a low network footprint ensures high overall system performance. Optimizing your User Interfaces for high performance reduces waiting time and empowers users to be more productive.
- Best Practice Plug and Play Launch Pads Apps optimize many standard processes in 3DSPACE & 3DDASHBOARD without the need to build your own configurations - for a quick and low risk implementation.
- Simplify Upgrades by configuring version-independent products rather than writing version-specific custom code.
Value Components
File Manager
Simplify working with documents. Stop wasting time searching, uploading, and worrying about revisions.
Personal Browser
Access data and make critical decisions on the move.
Structure Browser
Navigate, build and edit structures quickly and easily in ENOVIA & 3DEXPERIENCE.
Graphic Reporting
Locate your data quickly and view it in an immersive visual interface. Create visual workflows.
Grid Browser
Aggregate, compare and edit complex data and relationship objects in a single view.
XBom Manager
Provides a user interface to reconfigure the engineering build (EBOM) into a series of Manufacturing builds.
MCAD Optimizer
Enhance the usability of MCAD integrations based on the ENOVIA Integration Exchange Framework (IEF) & UPS.


